Note: This article is translated from my Japanese article .
About this app
I built a web app for working with Japanese grid square (mesh) data using R Shiny .
A grid square is a division of (Japanese) regions into roughly square cells based on longitude and latitude, and it is commonly used as an aggregation unit for statistical data.
The app I built provides some of the functionality of the R package jpgrid . The app offers the following features:
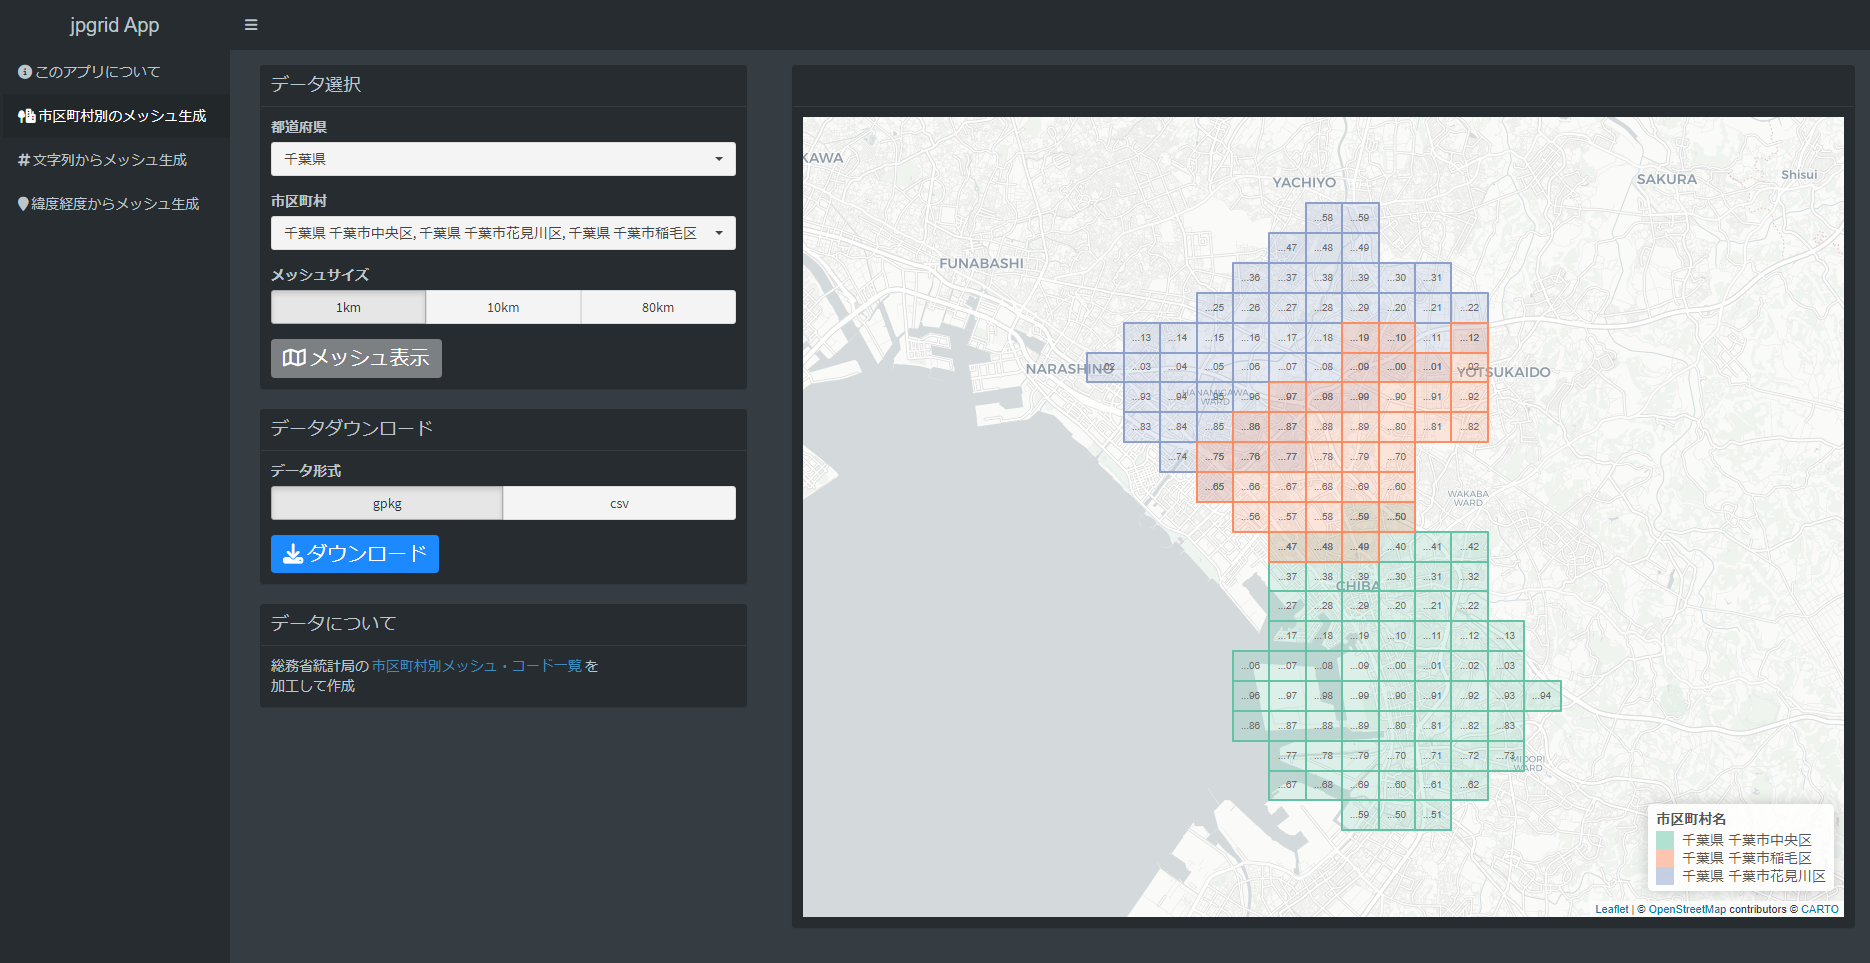
Generate grid square data by municipality
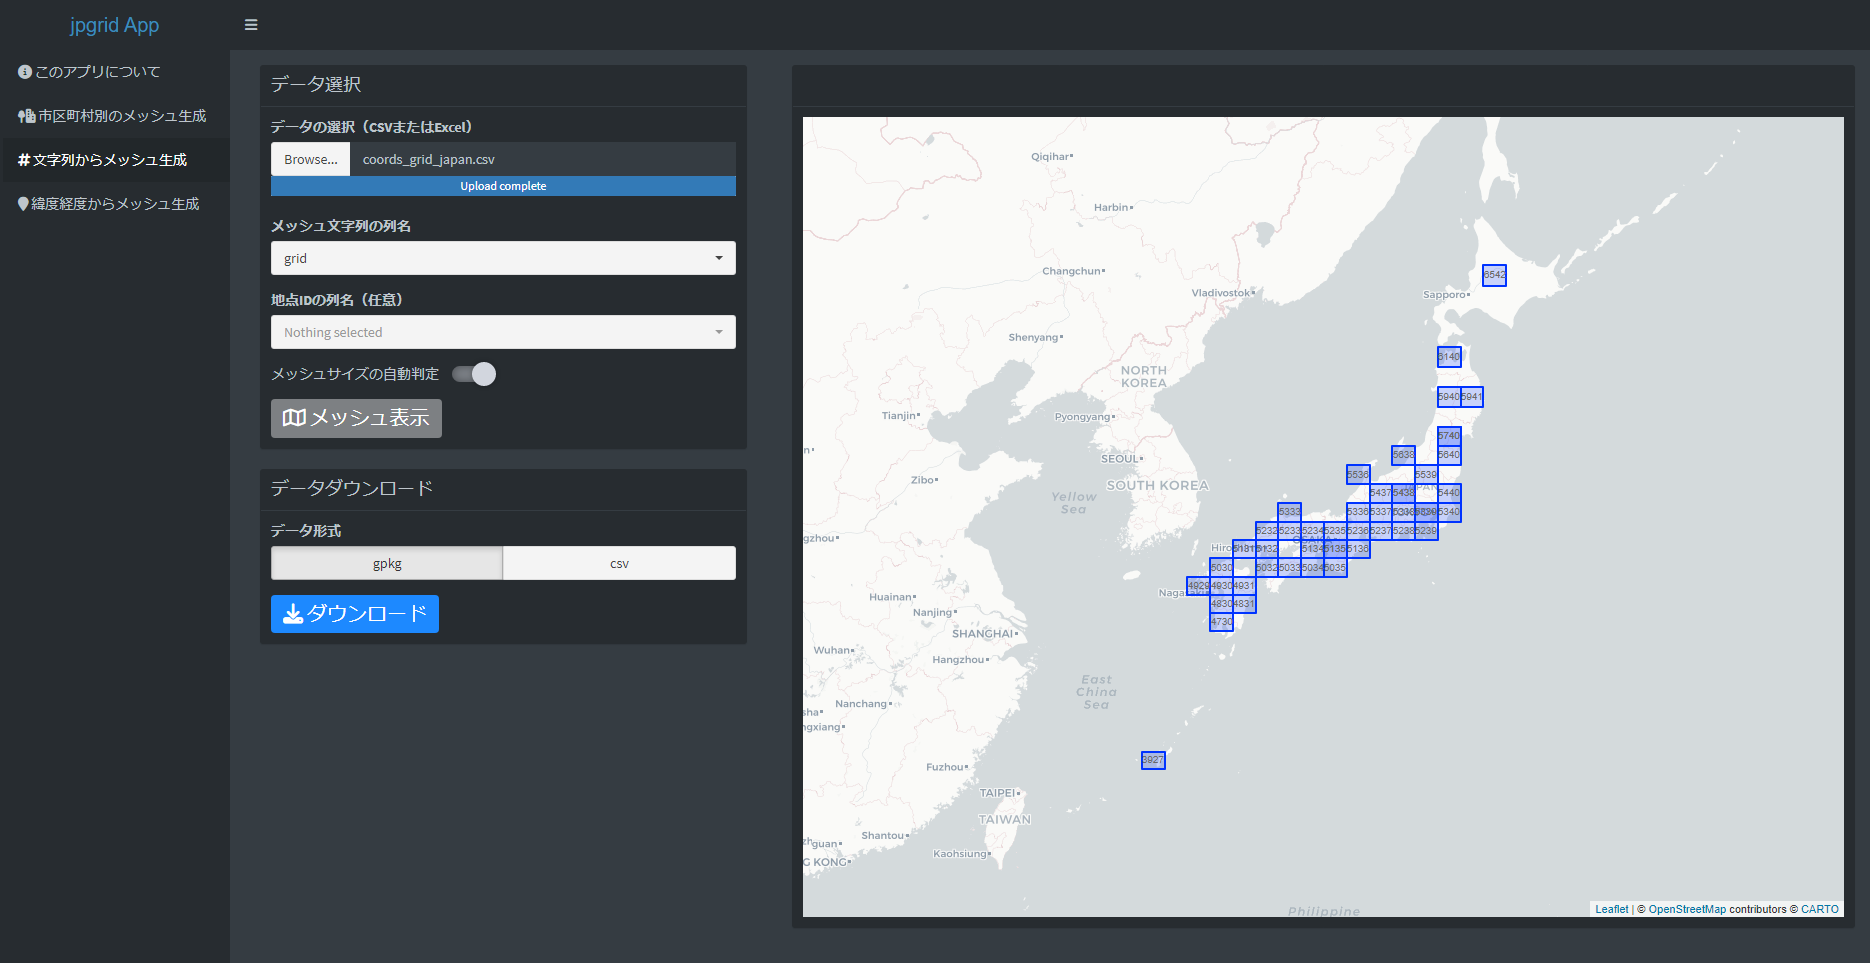
Generate grid square data from tabular data containing grid code strings
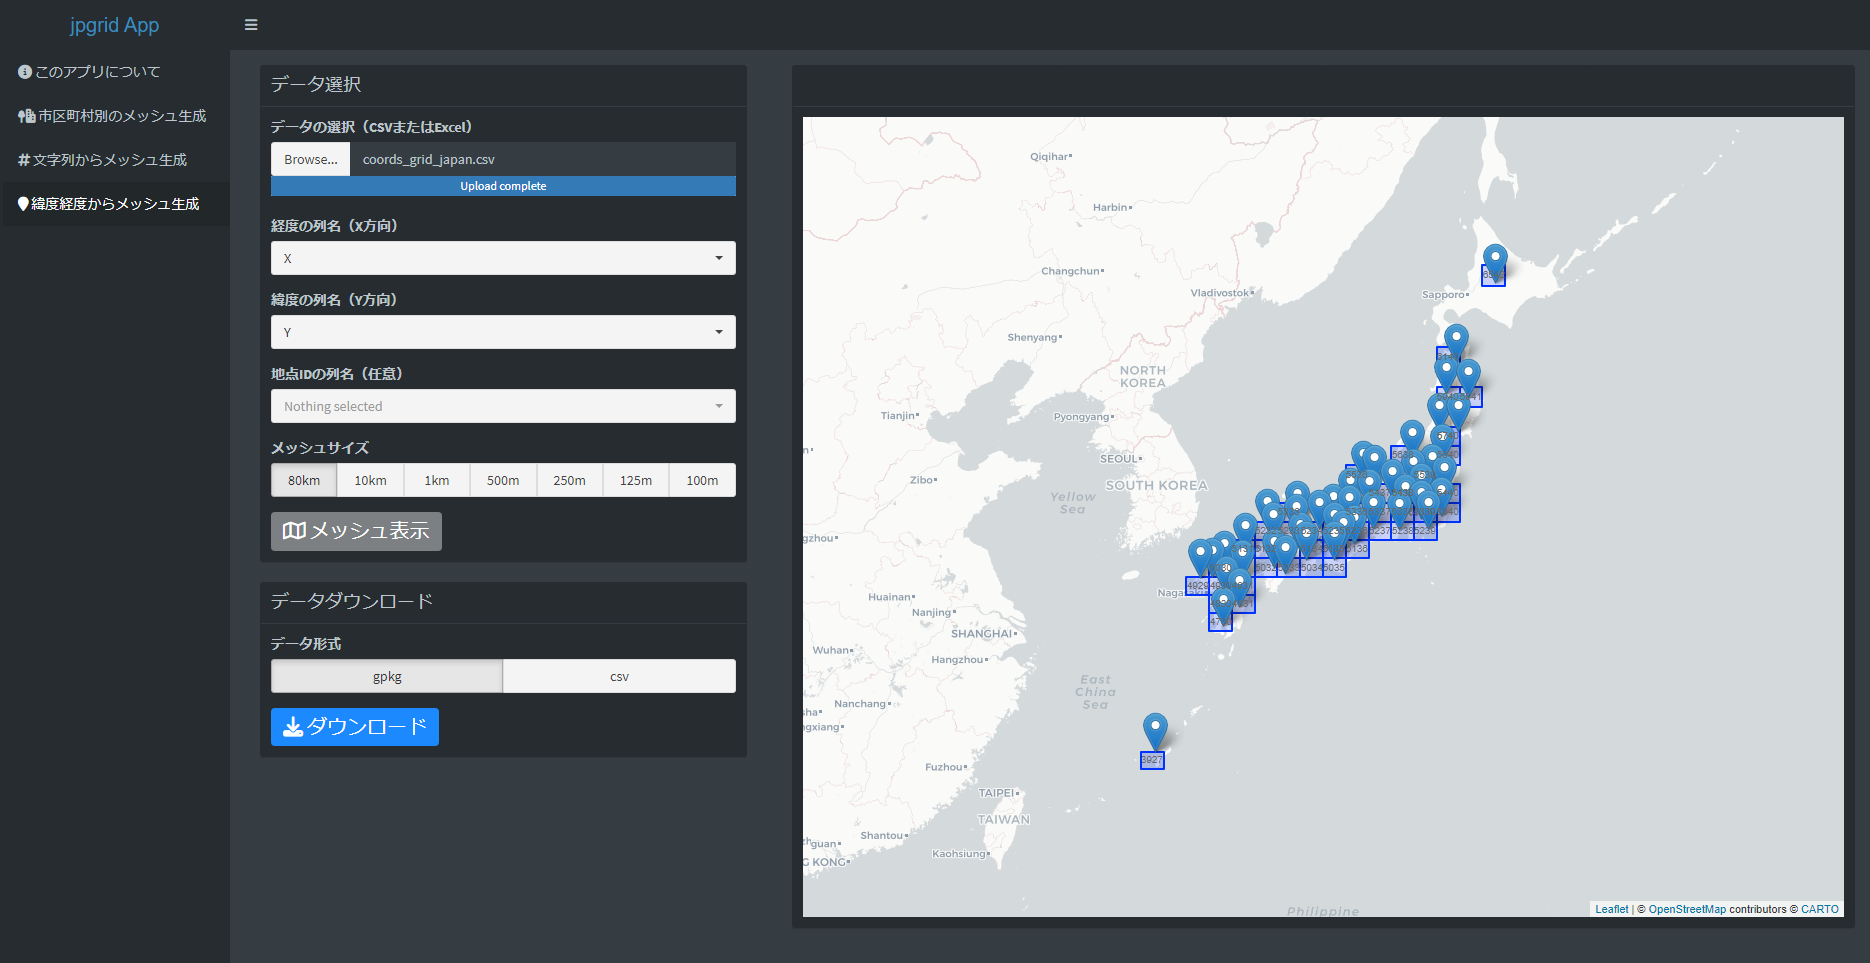
Generate grid square data from tabular data containing longitude/latitude
App features
Generate grid square data by municipality
It retrieves grid squares by municipality from the List of grid square codes by municipality published by the Statistics Bureau of Japan.
You can generate and save grid squares by municipality using the following steps:
Select prefecture(s) (multiple selection allowed)
Select municipality(ies) (multiple selection allowed)
Select a grid size (1 km, 10 km, or 80 km) and click “Show grid”
Select a data format (GeoPackage or CSV) and click “Download”
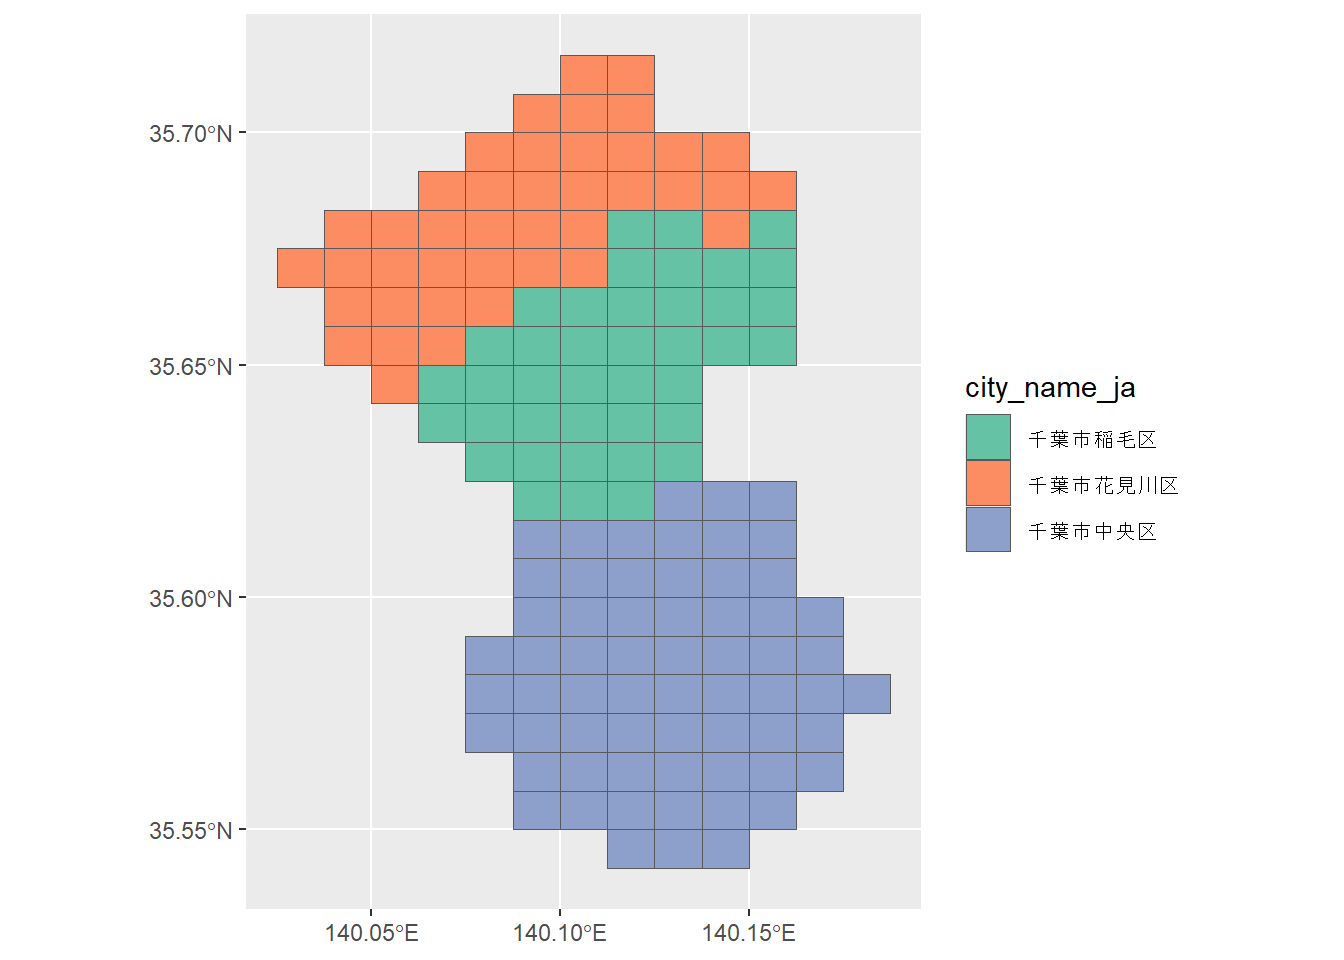
The jpgrid package provides grid square data by municipality via the grid_city_2020 dataset.
You can visualize grid square data by municipality as follows.
library (jpgrid)library (tidyverse)<- 6668 |> filter (city_name_ja %in% c ("千葉市中央区" , "千葉市花見川区" , "千葉市稲毛区" )) |> grid_as_sf (crs = 6668 ) |> ggplot (aes (fill = city_name_ja)) + geom_sf () + scale_fill_brewer (palette = "Set2" )
Generate grid square data from tabular data containing grid code strings
You can generate and save grid squares from tabular data containing grid code strings using the following steps:
Select data (CSV or Excel)
Specify the column name containing the grid code strings (a point ID can also be specified) and click “Show grid”
Select a data format (GeoPackage or CSV) and click “Download”
In the jpgrid package, parse_grid() can be used to generate grid squares from strings.
Generate grid square data from tabular data containing longitude/latitude
Similarly, you can generate and save grid squares from tabular data containing longitude/latitude using the following steps:
Select data (CSV or Excel)
Specify the column names for longitude (X) and latitude (Y) (a point ID can also be specified) and click “Show grid”
Select a data format (GeoPackage or CSV) and click “Download”
In the jpgrid package, coords_to_grid() can be used to generate grid squares from strings.
Conclusion
I introduced a web app for grid square data built with R Shiny.
The jpgrid package used to build this app provides many other features not included in the app. For details, please see here .
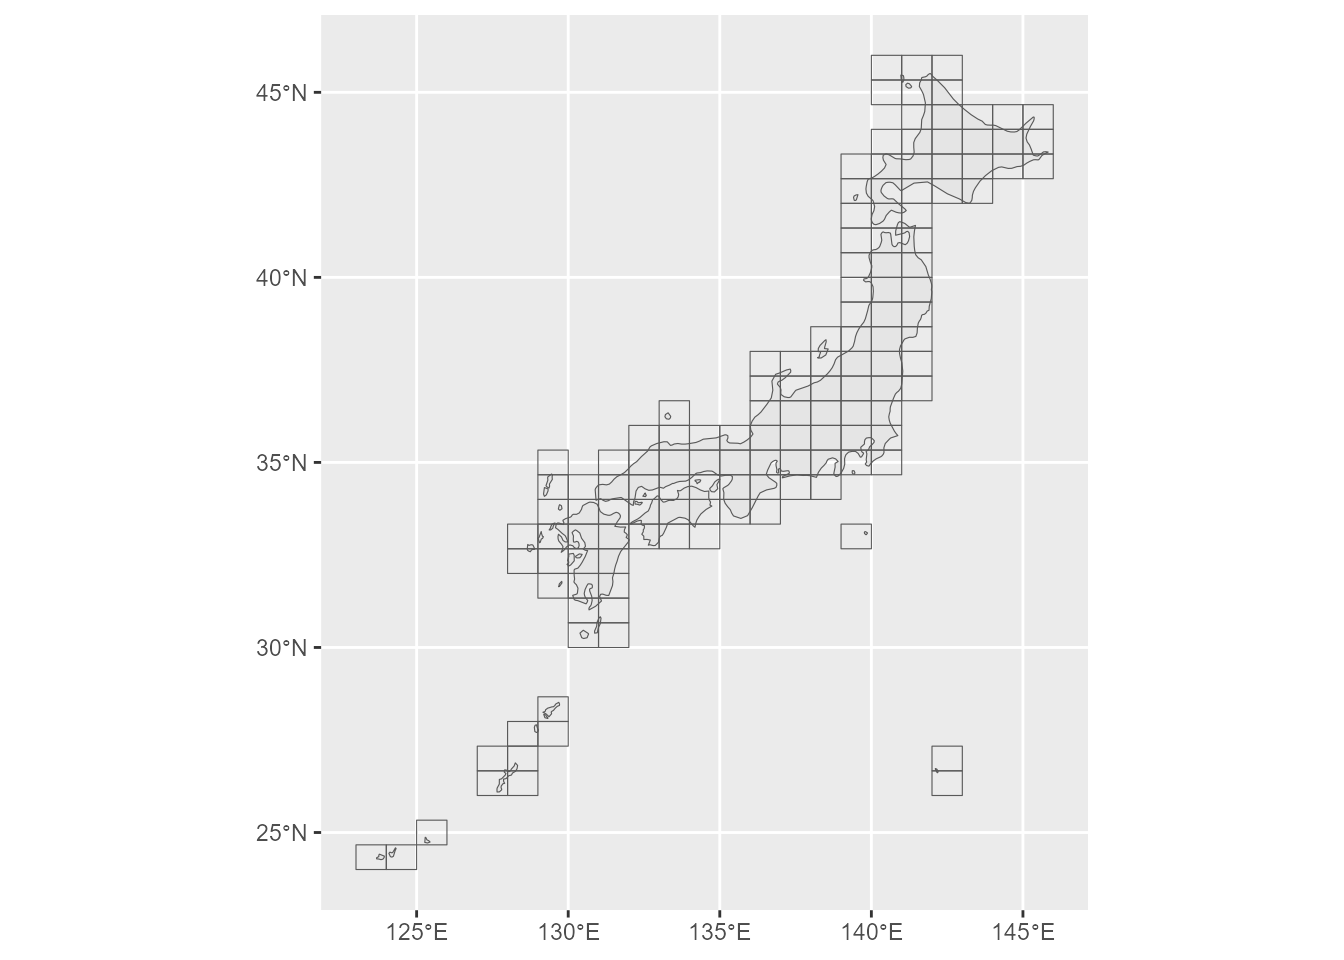
For example, there is geometry_to_grid(), which converts geometries into grid squares.
I encourage you to try using the jpgrid package for your grid square data analysis as well.
<- rnaturalearth:: ne_countries (country = "japan" ,scale = "medium" ,returnclass = "sf" )<- japan |> geometry_to_grid ("80km" ) |> :: first () |> grid_as_sf (crs = sf:: st_crs (japan))|> ggplot () + geom_sf () + geom_sf (data = grid_japan,fill = "transparent" )